My Journey with Xcode Instrument's Time Profiler
may 10, 2023 4 mins read
A new feature I've written in an iOS app (not Adobe Acrobat but something else with an enormous user base) is in its A/B testing phase with a small population on production. Unfortunately, after a few weeks, the experiment result shows that the "feature enabled" group members experience a larger application hang time (measured by MXAppResponsivenessMetric.histogrammedApplicationHangTime - click here for more info), so I start doing the most sensible thing for the moment: reproduce the "hang", and - since I don't measure time by milliseconds - use the Time Profiler from Xcode Instrument to record the whole process.
Having spent most of my professional life centering divs and (more recently) tweaking NSLayoutConstraints to make sure my button occupies the right pixels (how fast? I don't care that much), I am dreadfully amateurish with performance optimization and debugging, and have zero prior experience with the time profiler. From a first-timer's perspective, here's my take on the time profiler:
It does display all the information I need to debug my stuff... but it's SOOOOOO damn counterintuitive to use!
It took two WWDC videos (Track down hangs with Xcode and on-device detection and Understand and eliminate hangs from your app ) and my numerous trials and errors to learn how I should navigate this tool. Here are the "mistakes" I've made that have costed me a long time -
1. Recording with "immediate" recording mode instead of "deferred" mode, which is the sole cause for a "severe hang" in the profile.
The "severe hang" doesn't occur when I run the app without my feature so I got panicked thinking that there was "severe" issue in my code that I had to fix immediately, and spent a long time to investigate this... until I tried recording my feature again with "deferred recording mode." With the deferred mode, I got a result that made sense (a "microhang" which lasted for the duration of time a line of code from my feature executed that made the main thread busy,) and that was when I realized that the "severe hang" was most likely a "severe prolongation of my microhang" caused by the profiler.
2. The call stack in "Profile" is ordered by time it takes for each call, not chronical order.
It's actually obvious, because the header row for the first column says "Weight" in bold. Yet it's so counterintuitive to me because I always think about code by the time and order the get executed. Let's assume the following rows are in the "Profile" section
25ms ⌄ main
15ms   ⌄ Foo
10ms   ⌄ Bar
I don't think I'd be the only one who would automatically assume that the code would be written as
func main() {
    Foo()
    Bar()
}
but no - it's perfectly possible that Bar() is called first.
And the worst part is that there is no way that you can order them by time! (Yes I know that's doable in "Samples" where you can check all the frames by clicking on each backtrace, but without the expandable arrows god it's so hard to read and think!)
3. Select a time period, and all calls in the profiler would use it's duration.
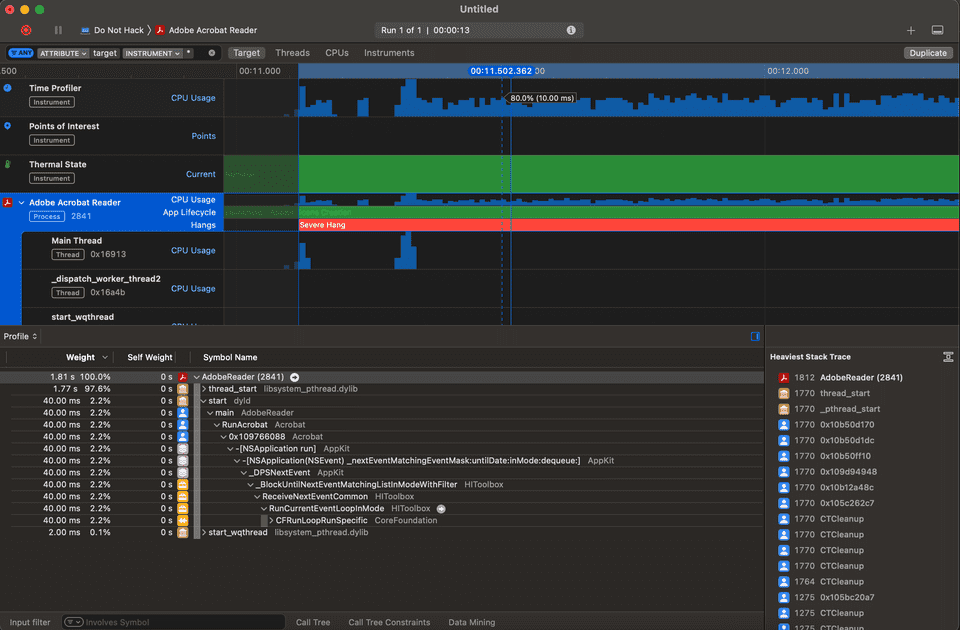
Let's refer back to the capture for Adobe in the screenshot above. It's telling you that the AdobeReader has executed for 1.81s.
That's actually not true. That should only be interpreted as "1.81s out of the period of my choice (in this case it's the duration of the severe hang), AdobeReader is executing." If you deselect that time frame and reselect the entire "Adobe Acrobat Reader" target instead, you'll see that the time is updated from 1.81s to 2.17s.
Similarly, if you choose maybe a 2ms time period, every line of code seems to be executing for 2ms, which, of course, doesn't happen.
Even though I have trouble adapting, I think I can see why it's designed this way. The same, however, cannot be said for the next part...
4. Even worse: same when you filter by symbol.
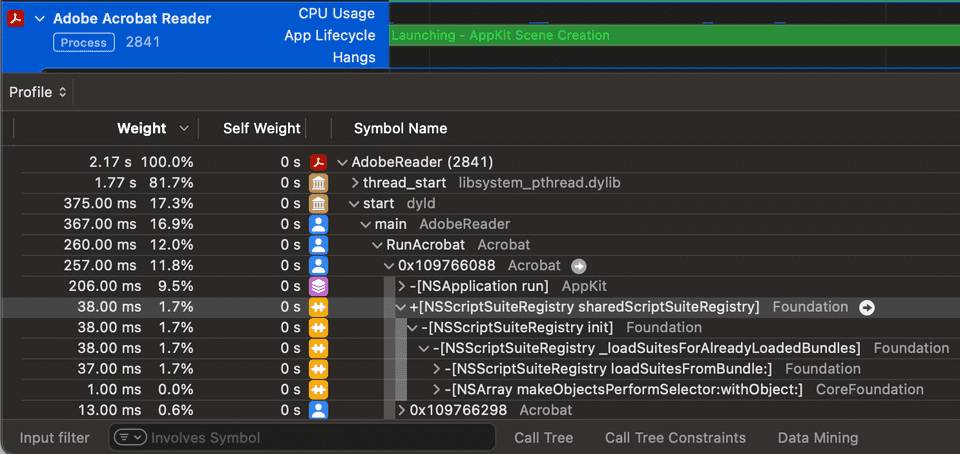
According to the time profiler, Adobe Acrobat on mac calls the method [NSScriptSuiteRegistry sharedScriptSuiteRegistry]. This call takes 38ms to execute, while AdobeReader takes 2.17s to run.

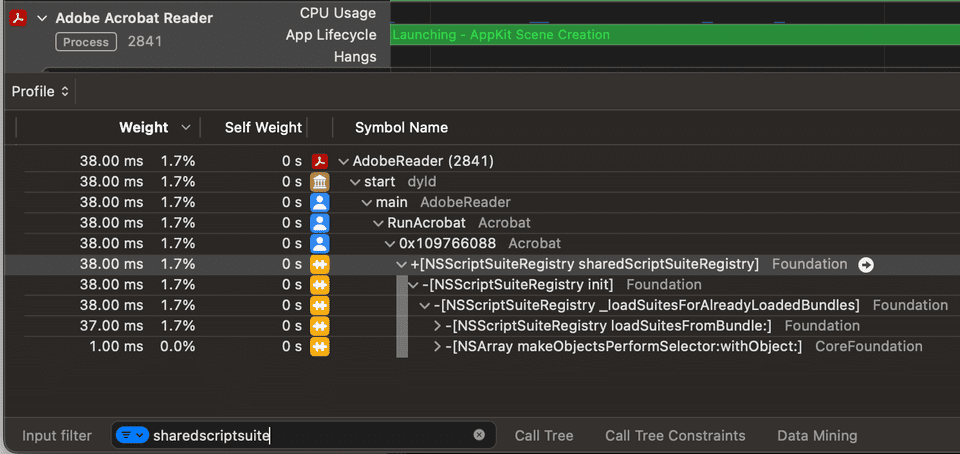
That is, until you put an input filter...

which totally doesn't make sense to me. (It definitely has nothing whatsoever to do with the call being selected; you can see in both screenshots that the sharedScriptSuitRegistry call is selected.)
5. Another small complaint
which is deemed unimportant by the four items I mentioned previously:
Can I get a "expand all / collapse all" button?
